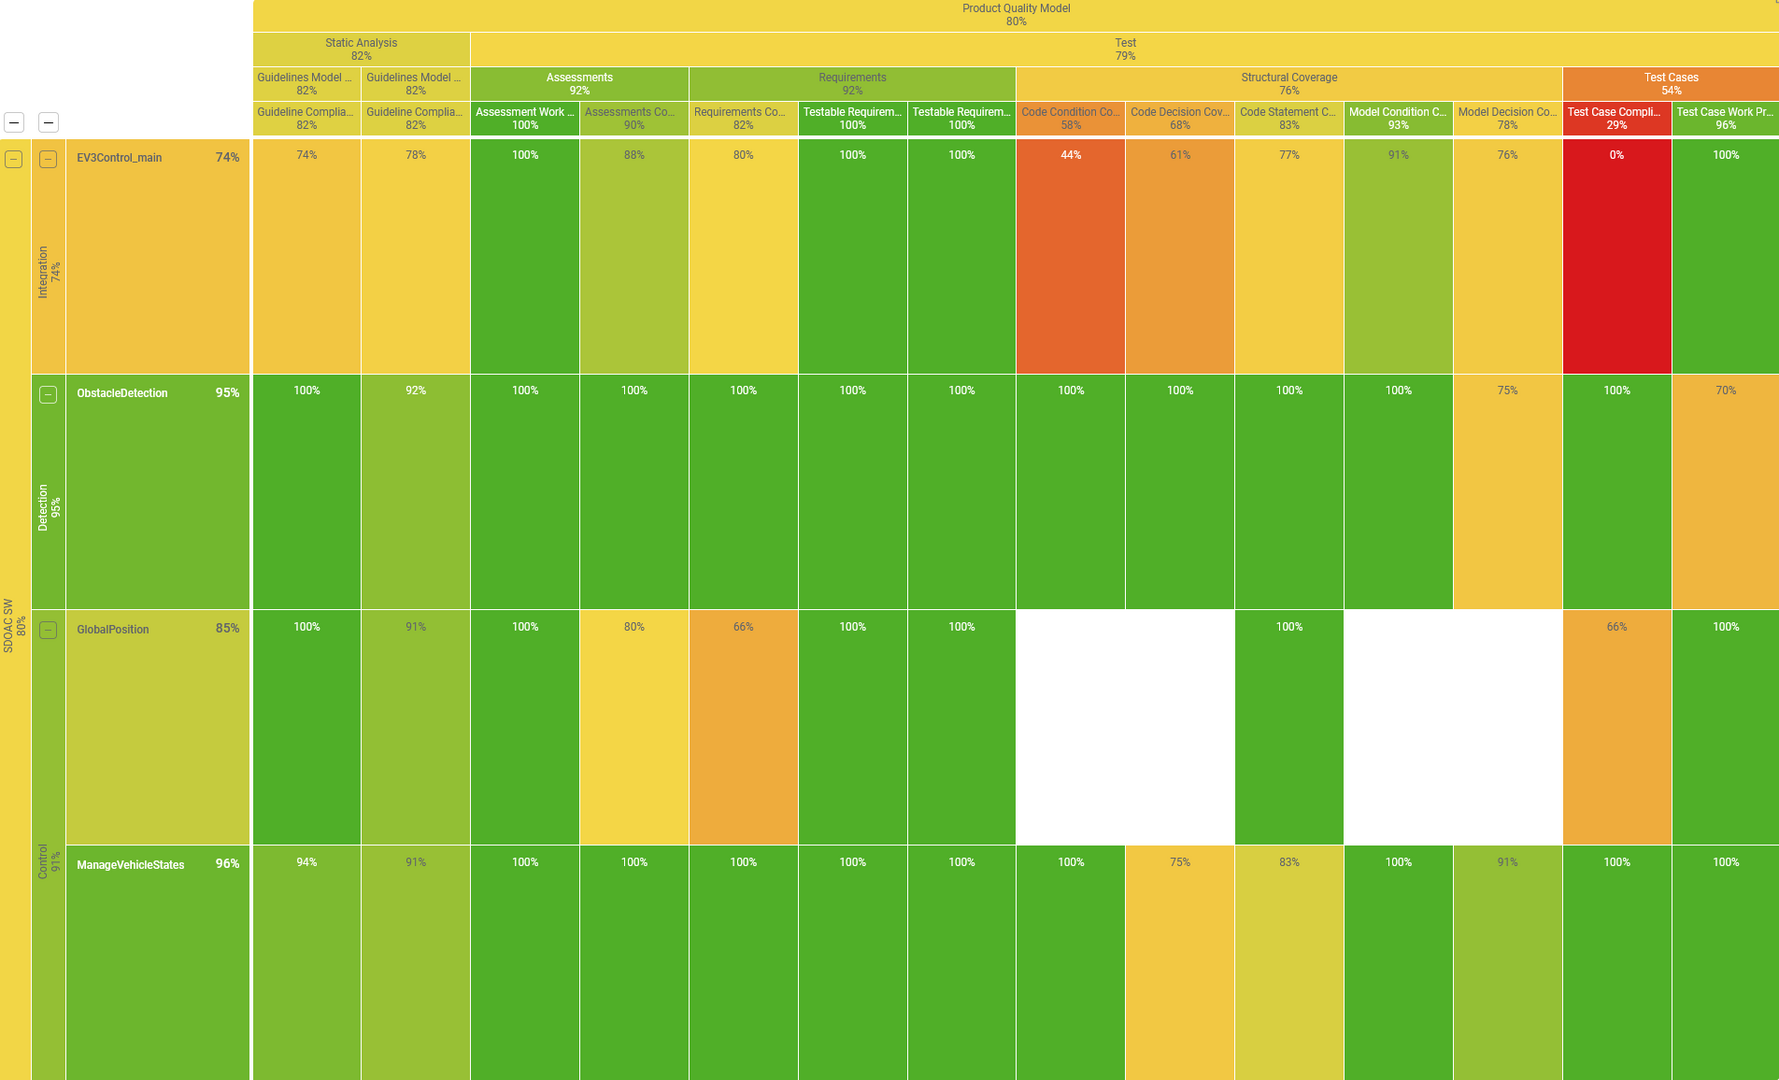
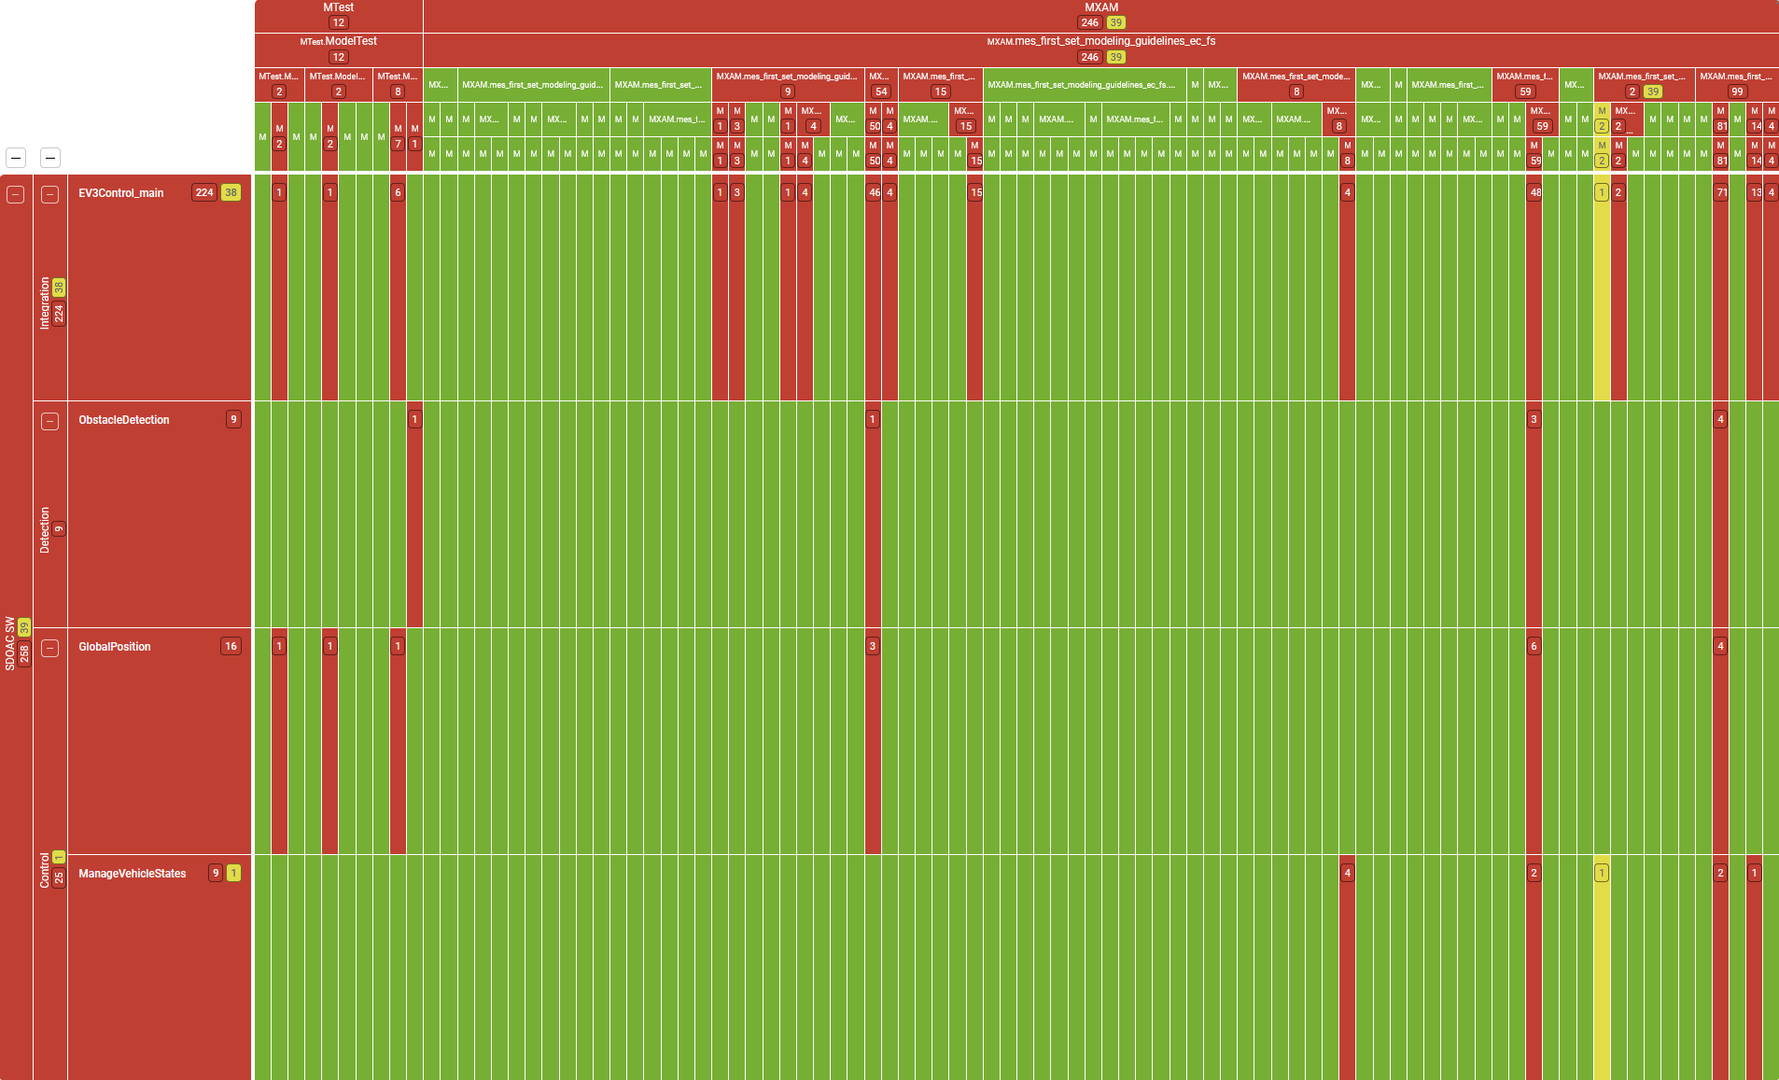
When you look at your project quality, the first thing you hopefully see is an overview. Aggregated metrics derived from quality assurance data provide insight into where things stand. These metrics summarize findings into percentages, trends, and status indicators. This overview is necessary and useful. It helps you orient yourself.
At the same time, however, it hides important information – by design.
What you see in an overview is the result of aggregation. What you do not see are the details that these metrics are built on. To understand where quality comes from, where risks form, and why numbers change, you must look at the findings behind the overview.